本节在内容上具有承上启下的作用。上一节提出了天气和气候的概念,而本节紧接着 就围绕天气和气候的基本要素之一——气温进行深入探讨。 本节主要从日变化和年变化两个方面讲述了气温的变化,从水平分布和垂直分布两个 方面讲述了气温的分布;并且以培养学生的读图和绘图能力作为一条重要线索贯穿其中。 气温知识是以后学习气候知识的重要基础,通过本节的学习,还可以培养和提高学生的读 图和绘图能力。 ...[详情]
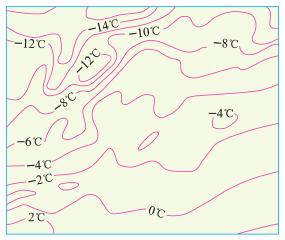
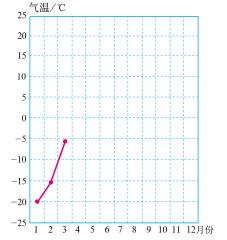
本节为人教版七年级地理上册第三章第二节,是气候部分的基础知识,内容包括气温的变化和气温的分布两大部分。前者涉及气温的测量、气温的日变化、年变化、温度变化曲线图;后者包括等温线图、气温空间分布规律等。本节课的教学内容在初中地理学习中,不仅容量大,而且难点多,但内在脉络清晰明了:观测气温,可以获取到一定量的气温数据,可以对气温数据进行一定的计算和整理。比如可以绘制出不同时间尺度的气温变化曲线图与不同空间尺度的等温线分布图。通过对气温日变化、年变化曲线图的判读,可以总结出气温的日变化和年变化规律;通过对等温线的判读,可以总结出气温的空间分布规律。 [详情]
实验目的:通过模拟实验,说明陆地与海洋受热和冷却的差异。 实验器材:大烧杯2只、小烧杯2只、温度计2支、石棉网2块、电磁炉1只、 小冰块500g左右、砂土、水。 实验准备:一只小烧杯内放入砂土(高度2/3左右),另一只小烧杯内放 入水(高度与砂土相同),分别插入一支温度计(不要让温度计触及烧杯底)。 [详情]
“室外的温度计明明都超 45℃了,为什么气象台测出的实况气温只有 38℃?”伴随着 上海气温不断创出的新高,最高气温值也触动着大家的神经。那究竟是大家手上的温度计 有问题,还是气象台测出的气温有问题呢? [详情]
 登录
登录